
College Student Section Leaderboard
Attendance you can rank, name, and put in front of your sponsors.
The names are made up. The campaigns and results are real.
Overview
Every athletic department has the same two crowds: the football Saturday crowd everyone photographs, and the Tuesday volleyball crowd nobody can prove exists. Instagram counts neither: followers and impressions mean nothing across the table from your president at budget time.
A check-in leaderboard fixes the measurement problem at the source. Each home game is an event; each event carries a check-in campaign; students check in from the app at the venue, location-verified, one check-in per fan per game. The department chooses what showing up is worth (more points for being in the building than for following from home), and the leaderboard does the rest: a running rank of the student section that keeps building all season, full of names, not estimates.

The output is the asset. Who shows up, how often, and for which sports: per fan, per game, exportable into the sponsor deck and the budget meeting. Fan engagement stops being a vibe and becomes a column of numbers only your department has.
Example Scenario
Brockmore State runs 19 sports and has 6,200 fans on the platform. The department creates an event for every home game (football, volleyball, both basketballs) and attaches a check-in campaign to each. Students check in from the Game Set Engage app at the venue, location-verified, one check-in per fan per game.
The department sets its own point values per campaign: 500 points for being at the arena, 100 for following from home. Football checks itself in; the interesting part is Tuesday. Volleyball's crowd of 40 becomes 40 named fans, and when the leaderboard shows the same 15 students at every non-revenue sport, the department starts a "most loyal section" shout-out at halftime.
By November, 2,900 distinct students have checked in at least once, the top fan has 41 check-ins across five sports, and the sponsor deck no longer says "great student atmosphere"; it says exactly how many identified students attended, sport by sport. Every check-in keeps building on the club leaderboard as the winter season rolls in.
Key Benefits
- Location-verified check-ins make attendance a provable, per-fan dataset
- One check-in per fan per game keeps the leaderboard honest
- Reward turning up for Tuesday volleyball, not just football Saturdays
- Attendance numbers your sponsor deck and budget meetings can actually cite
More City Plan Examples
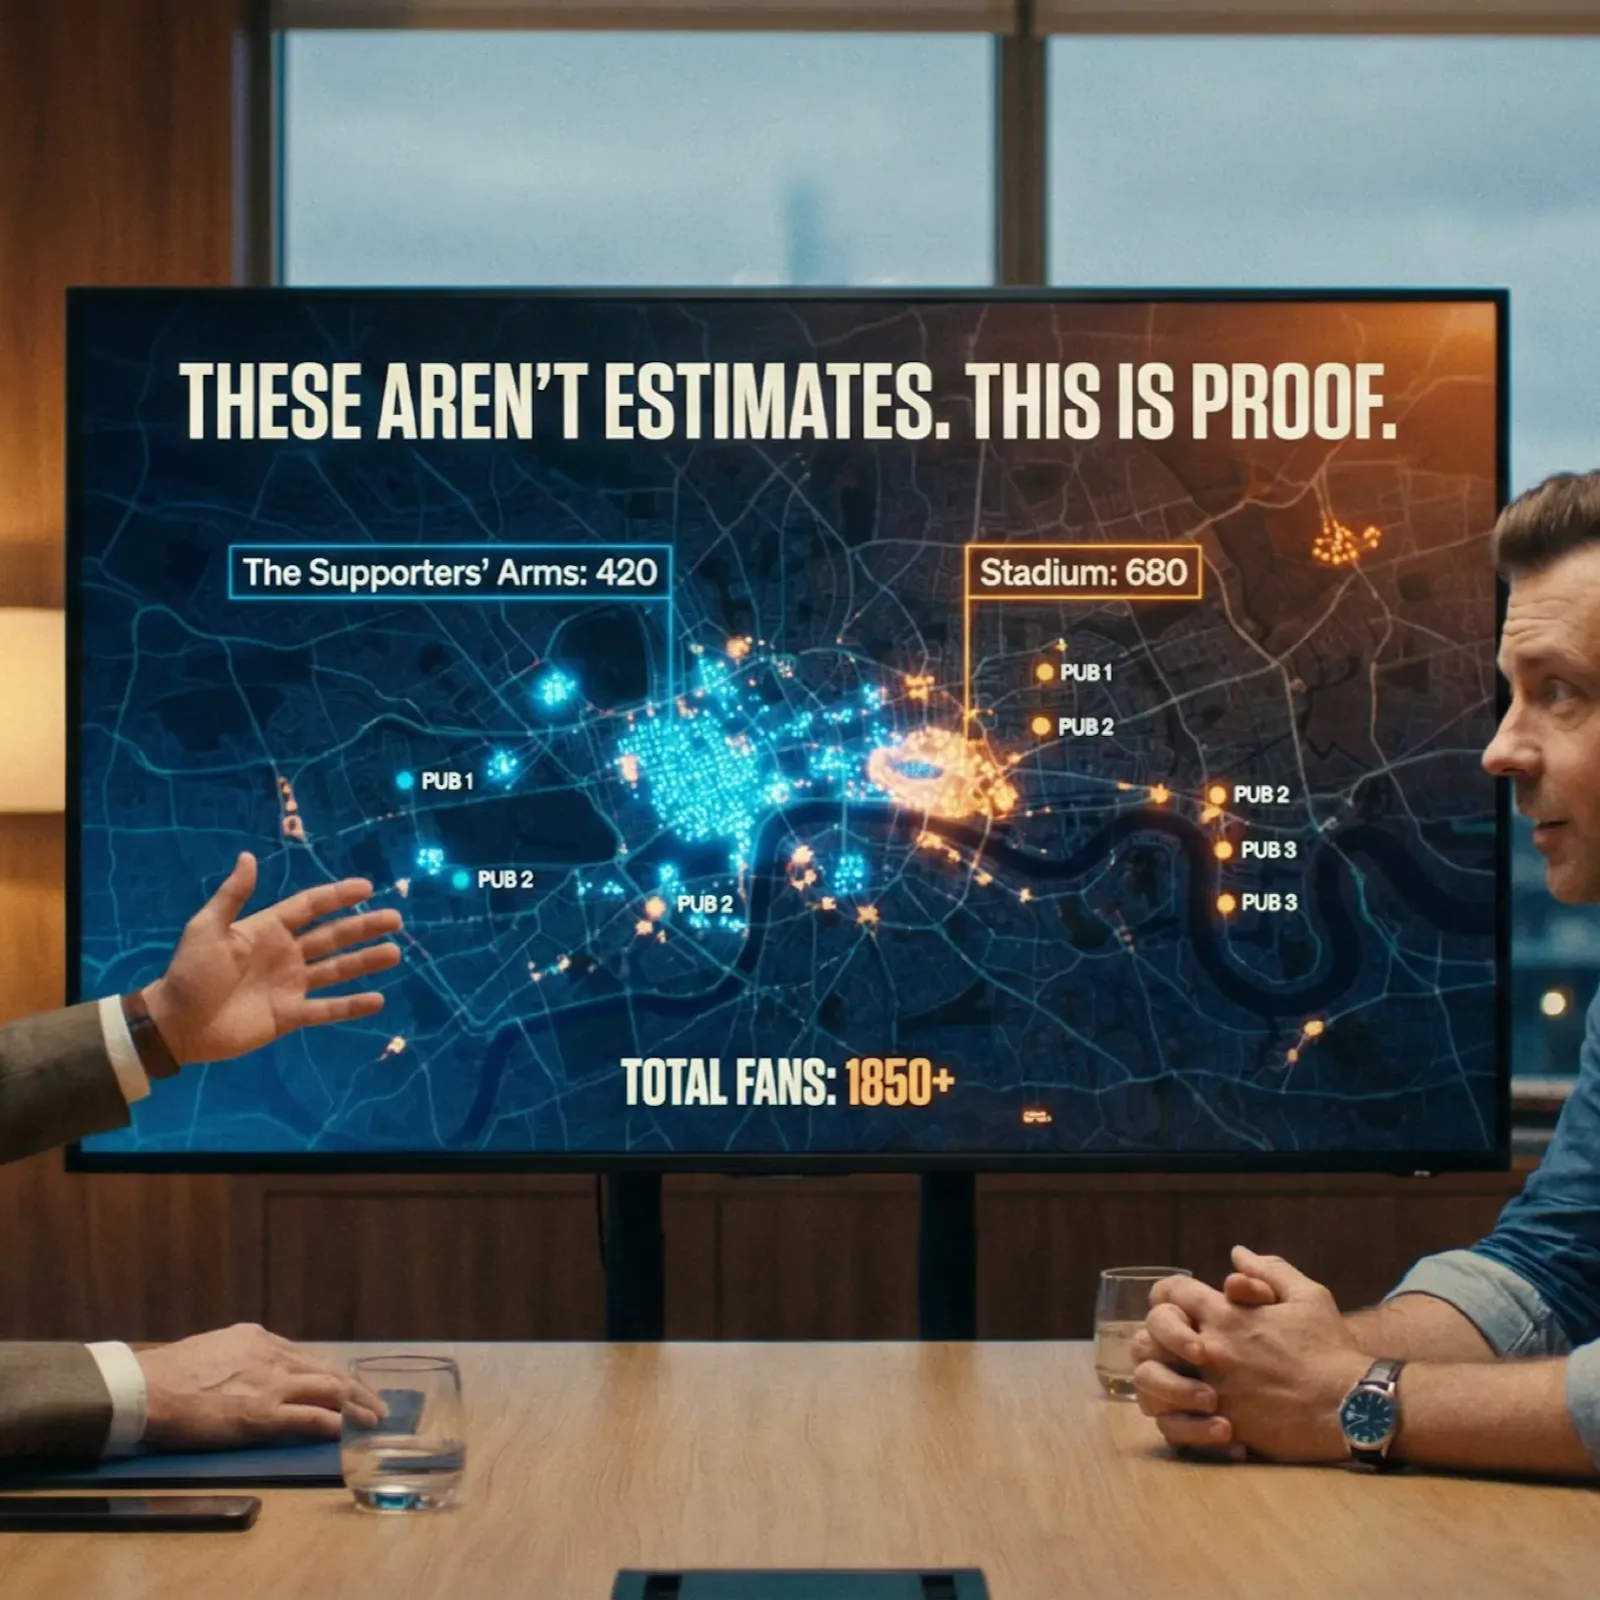
City Football Supporters Match Day Network
See who watches where on match day. Stadium, partner pubs, at home.
View example →
College Football Game Day Exclusive Deals
One unique code per booster. Tracked, limited, and impossible to leak online.
View example →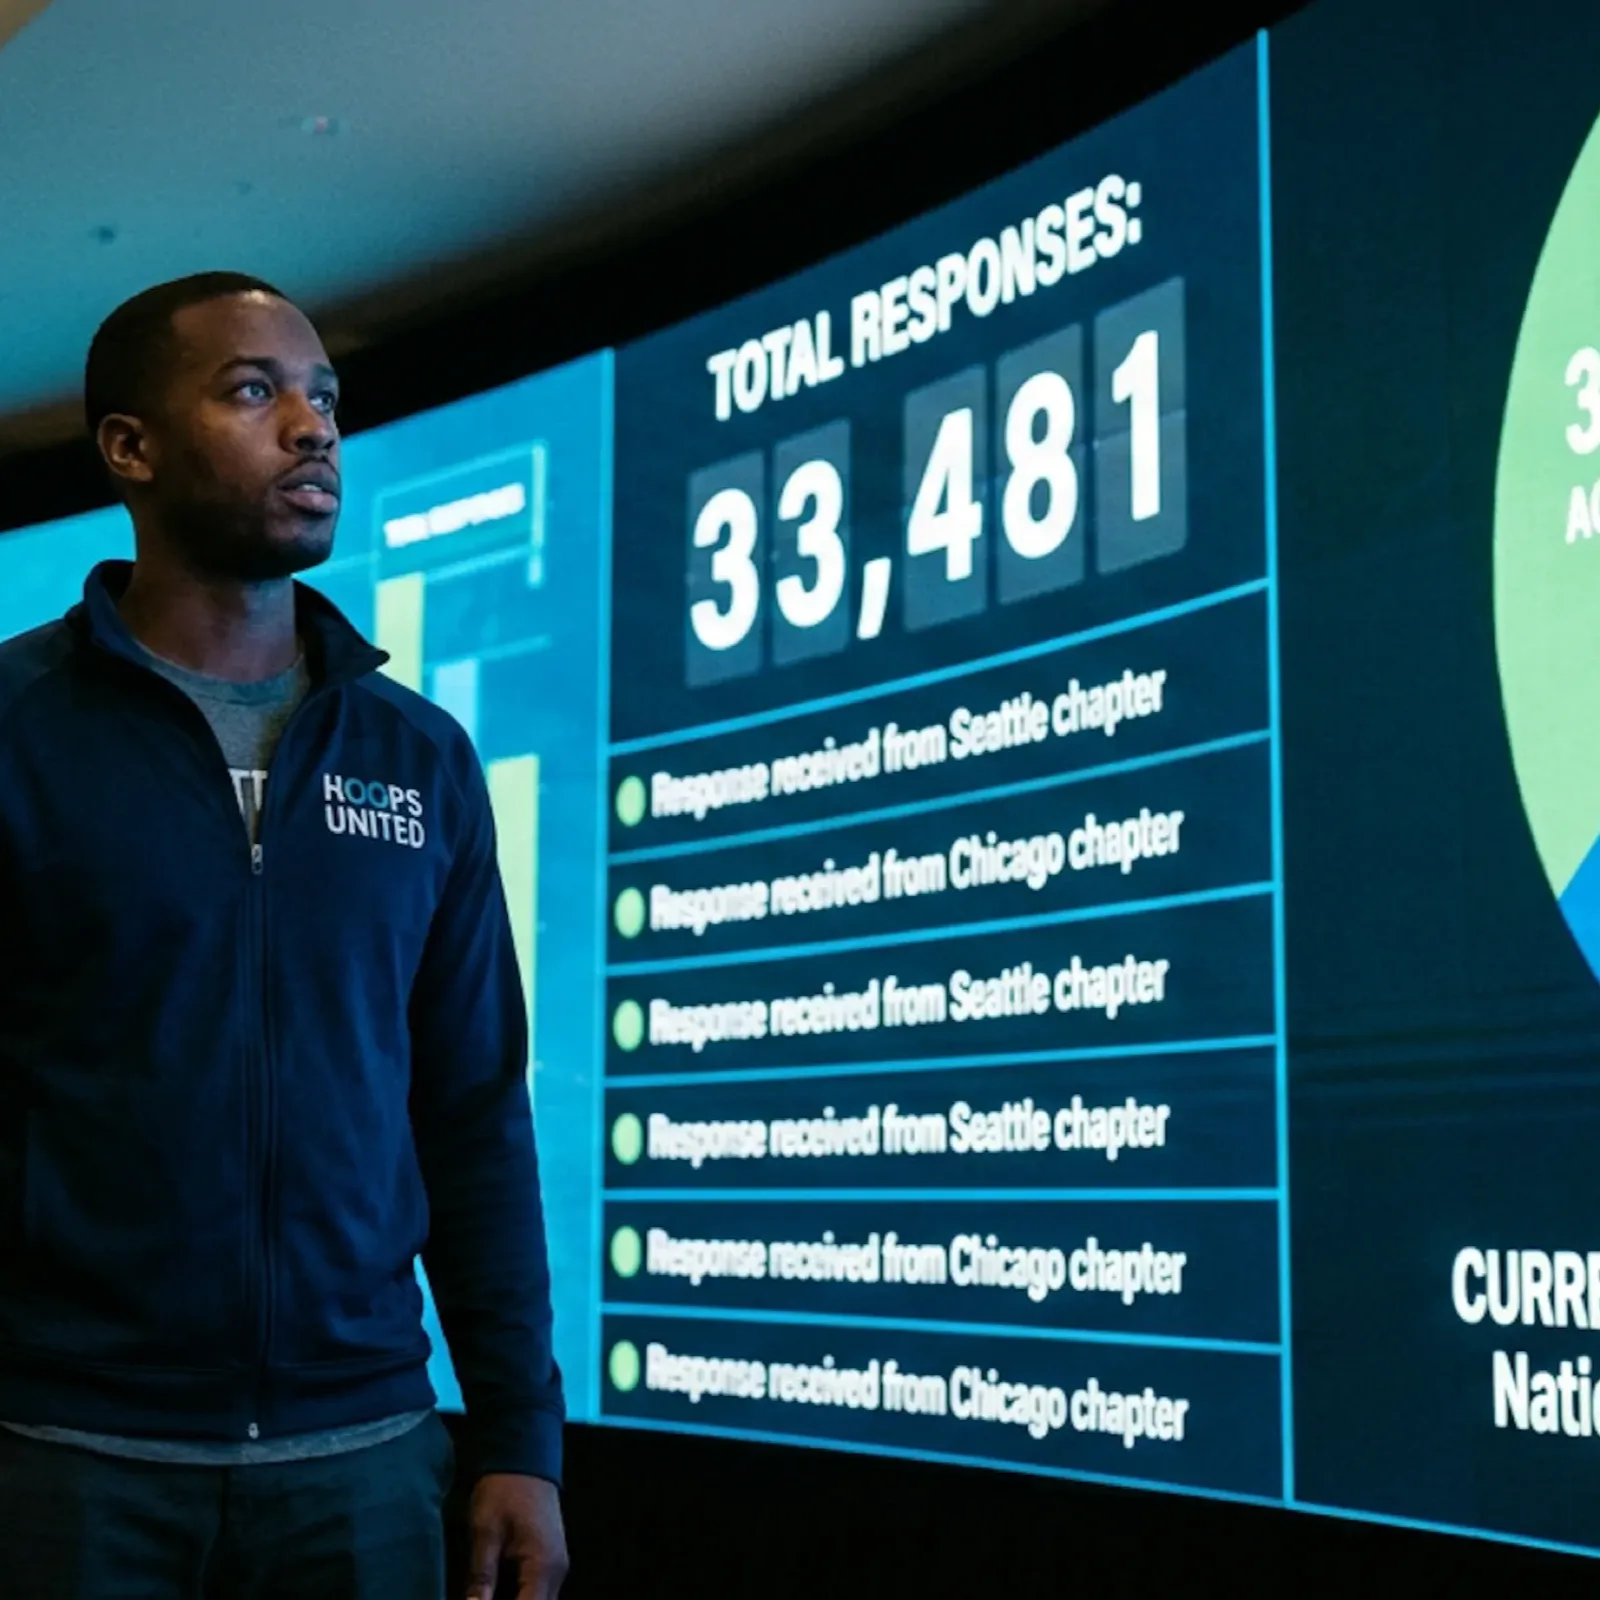
City Basketball Fan Experience Survey
Find out what 6,000 fans actually think about the match-day experience
View example →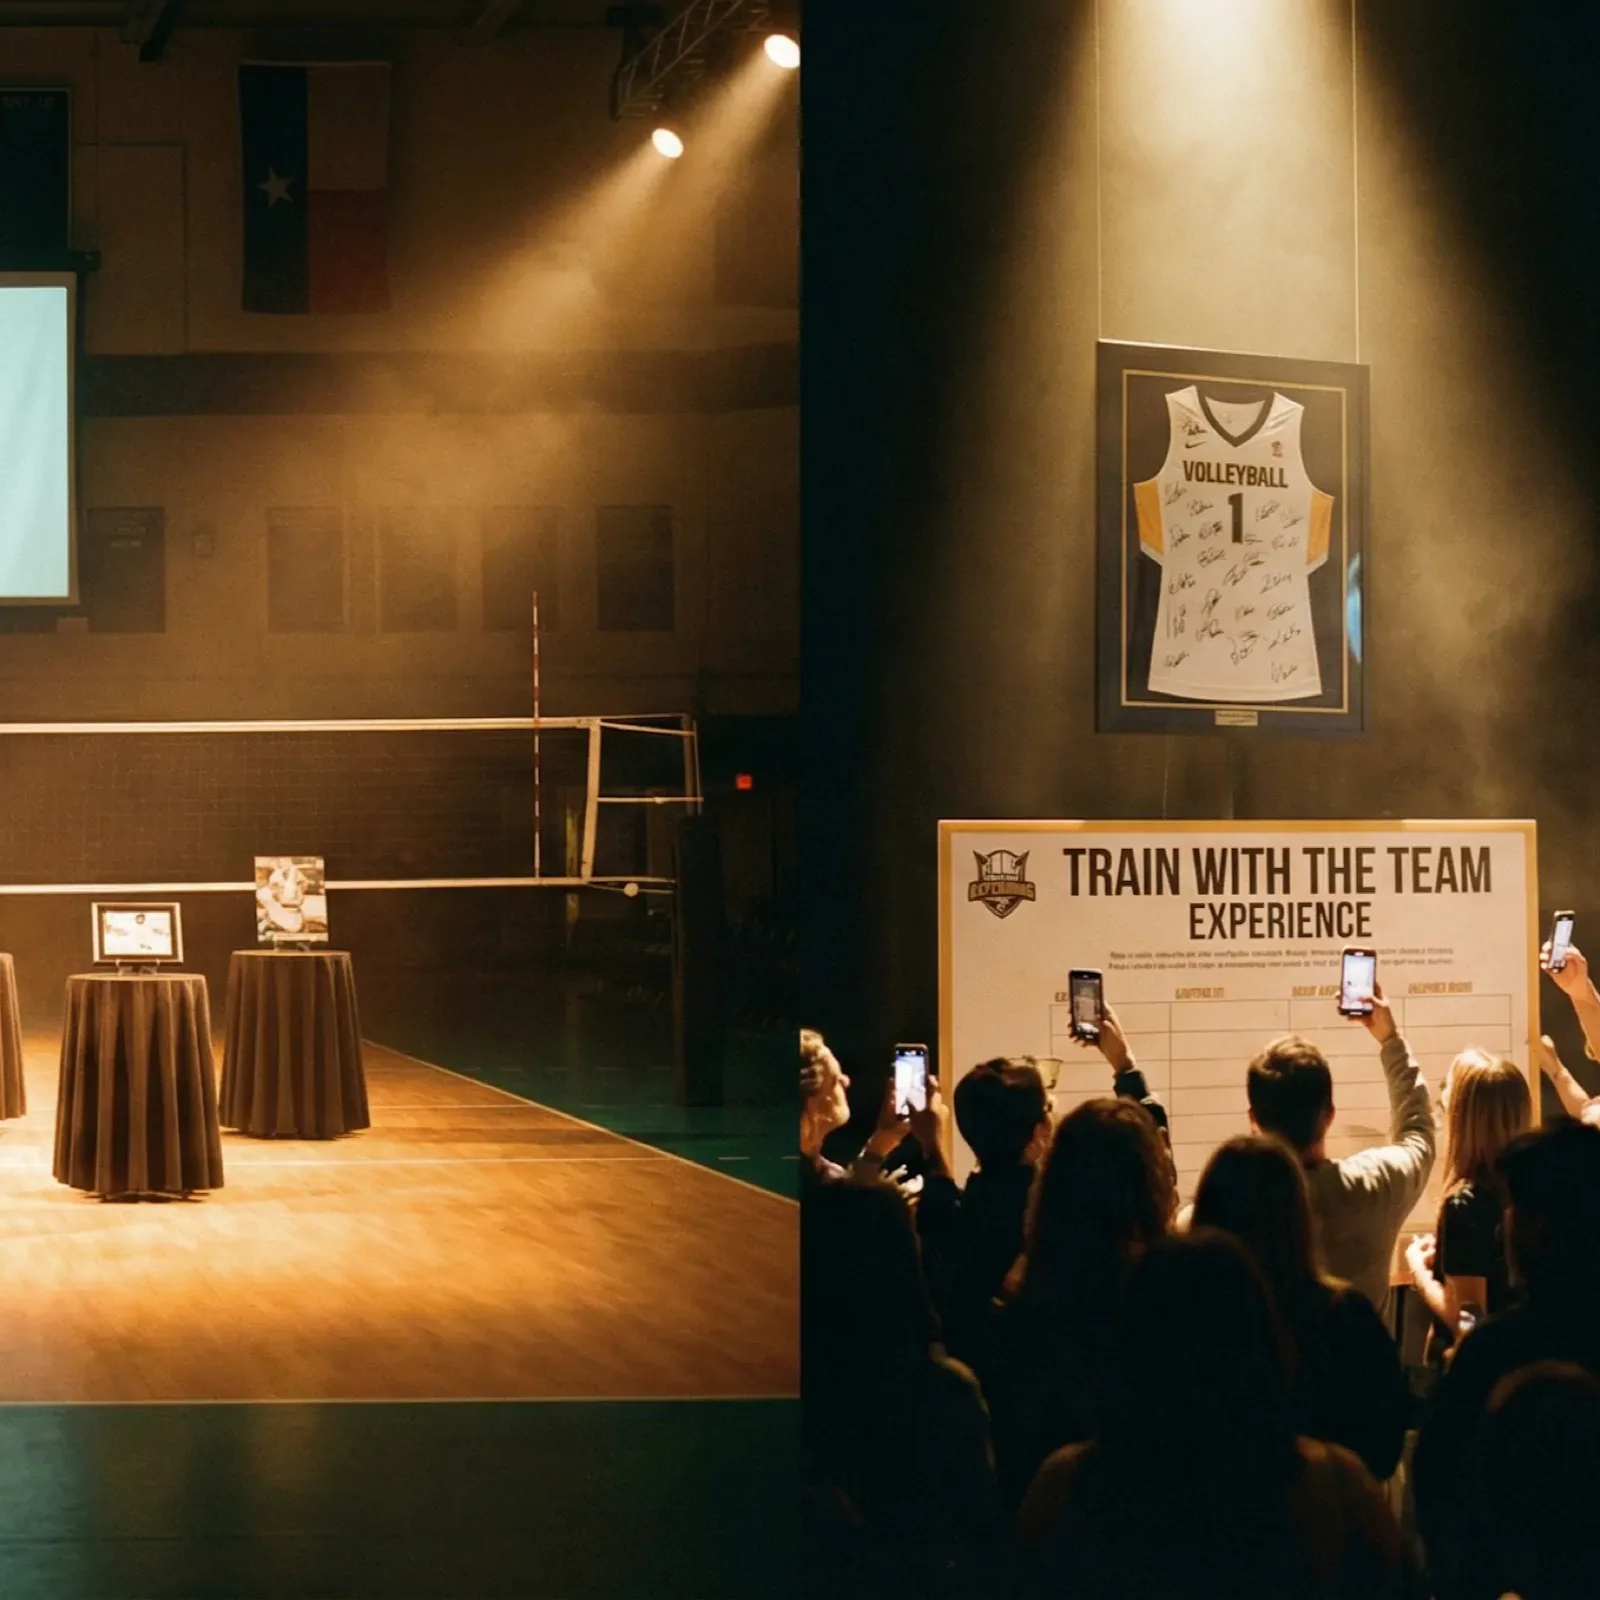
Women's Volleyball Season Highlight Auction
Fans spend their season's points on signed kit, player experiences, and courtside seats
View example →Your First Campaign Takes 5 Minutes
Set up a campaign like this one. Free to start, no credit card.